Fishbone Diagram

Facebook
Twitter
LinkedIn
Engineering Area
Analysis & problem definition, Assessment & evaluation
Group or Individual
Group
Amount of People
Up to 15
Type of Class
Practice-based
Duration of Activity
Half an hour or less, Between half an hour and one hour
Type of Activity
Collaborative team setting, On-line Classroom activity

Description

What is this technique about

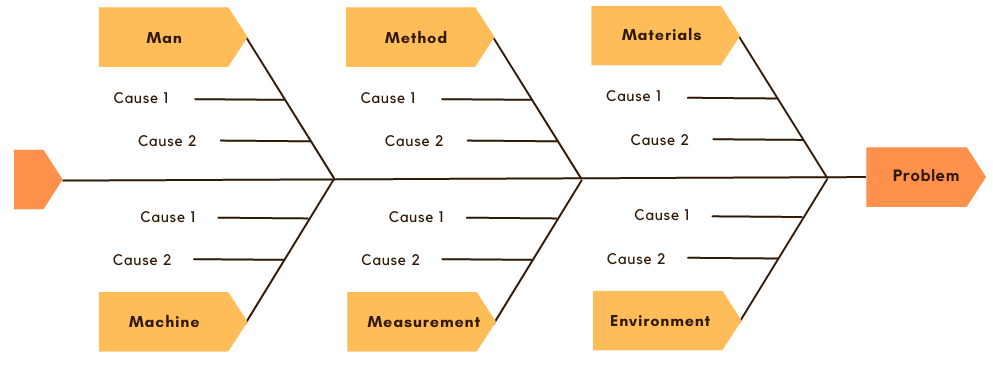
A fishbone diagram is a visual tool used to identify the root causes of a problem. The method is a more structured approach to other root cause identification tools such as 5 Whys. The problem or the effect is displayed on the head of the fish (as shown in the figure below), and the possible causes are listed along the smaller bones of the fish under various categories. It is also possible to create nested causes.

A Fishbone diagram is a structured method for identifying the causes of a specific problem. The tool may be used to

    1. Identify the root causes of a problem
    2. Categorise causes and understand the relationship between causes

Where does it come from 

The Fishbone diagram or the Ishikawa diagram was developed by professor Kaoru Ishikawa, a pioneer in quality management In 1960’s and was published in his book “Introduction to Quality Control” In 1990.

For which purposes it is used (why in your engineering teaching)

The Fishbone diagram can be used in the beginning of creative processes of the engineering design process, i.e., the initial problem analysis. The method is ideal to analyse the root cause of a problem, and activate structured thinking and reasoning process.

How to use it

    1. Identify the problem by creating a clear problem statement. (example of a problem. “students having lower attention span in class”). The problem/effect is written on the head of the fish  (see the figure for reference).
    2. Brainstorm the major categories of the causes of the problem. A facilitator should manage the conversation and to document the causes mentioned during the brainstorming session. The categories of the causes can be customised according to specific needs. However, the categories generally include:
        1. Methods
        2. Machines
        3. Materials
        4. Measurement
        5. People
        6. Environment
    3. The causes may be written down along the smaller bones based on the categories. If required, it is possible to mention the causes in multiple categories and create branches within the causes (as shown in the figure). Layers of branches indicate causal relationships.
    4. Using the listed causes and inferred causal relationships, identify the root causes of the problem and prioritise them. Prioritising the root causes is important if the activity is required to create solutions later . This process of prioritising the root causes can be further subdivided as follows:
        1. Each of the team members and the facilitator is allocated a specific number of votes (say 5 and represented by a “”). The number of votes alloted to each of the Identified cause (as observed from the fishbone diagram), indicates the criticality of the cause. Higher the number of votes, higher is the critical nature of the cause.
        2. The team members and facilitator allocate their votes to one or more identified causes in the fishbone diagram (but limited to a total of pre-agreed limit, in this case 5).
        3. Based on the total count of votes against each of the identified causes (as observed in the fishbone diagram), the identified root causes can be prioritised for generating solutions.

How to implement this techniques online

In an offline setting, the Fishbone diagram requires not more than a whiteboard and a marker. However, in an online setting, the methods require a combination of more than one tool. The method require a video/audio conferencing tool for collaboration and a digital whiteboard for documenting and voting the process.

For video conferencing, tools such as Microsoft teams, Zoom or Google Meet can be used. Please note that clarity in audio is required during this session rather than video. Tools such as Miro, Mural or concept board can be used too.

Preparation, what do before the session

    1. Prepare a time schedule for this session and inform the students in advance with the required links.
    2. Create a well-defined problem statement. The Fishbone technique requires a well-defined problem, and having one can help in achieving desired learning outcomes for the students.
    3. Prepare a workspace using whiteboard tools such as Miro or Mural and include a template for a fishbone diagram. Both Miro and Mural application have free fishbone diagram templates. This would ensure that no time is wasted during the session.
    4. Add students as team members in the created workspace and inform them to join the team before the session starts.

During application, i.e., while giving the session

    1. Start the online video conferencing session and ask the participants to log in to the shared whiteboard workspace.
    2. Share the workspace screen on your meeting so that the participants can observe the changes and additions even during discussions with the team.
    3. Use the post-it notes method available in digital whiteboards to post the causes. Encourage participants to use different colours to maximise engagement.

Follow-up, about what to do after the session

    1. Use the results of the session to ask the students to come up with creative suggestions to solve the identified root cause. This can be used as a starting point for another creative technique for finding solutions to a specific problem.

Examples and/or testimonials

Video online on YouTube:

Tools needed

For applying the technique in an online setting, the following tools are required:

    • A whiteboard allows for organising the data while allowing the members to work online on the same document collaboratively. Example tools:
      • Mural
      • Miro
      • Concept Board
    • A video/audio conferencing application allows for better brainstorming of ideas within the group and also allows the facilitator to have an overall moderating and facilitating effect.

Resources

Videos

LeanVlog. (2021, July 4). Fishbone Diagram – Ishikawa Diagram – Cause and Effect Diagram. [Video]. YouTube. Retrieved October 14, 2022, from https://www.youtube.com/watch?v=xkey1qByic4

DTI Training. (2015, May 16). Live Ishakawa Fishbone Diagram Build. [Video]. YouTube. Retrieved October 14, 2022, from https://www.youtube.com/watch?v=PkYBgHBVXsI

Papers

Watson, Gregory H., Spiridonova, Ekaterina A. (2019). Fish(bone) Stories: Reimagining the fishbone diagram for the digital world. International Academy for Quality, 52(8), 14-23. Available at: https://asq.org/quality-progress/articles/fishbone-stories?id=5c9adae78e3242588621ab300378d40b

Books

Ishikawa, K. (1991). Introduction to Quality Control. Springer Netherlands. Retrieved October 14, 2022, from https://books.google.ie/books/about/Introduction_to_Quality_Control.html?id=r8SvQgAACAAJ&source=kp_book_description&redir_esc=y

Tague, N. R. (2005). The Quality Toolbox. ASQ Quality Press. Retrieved October 14, 2022, from https://books.google.ie/books/about/The_Quality_Toolbox.html?id=dQW5qAC2H_IC&source=kp_book_description&redir_esc=y